Anatomy of a
backyard weather station
Every number on this site comes from four pieces of hardware in one back yard in north Georgia. No forecast model, no airport feed, no third-party API. This page is the whole machine, end to end.
The big picture
Fig. 01Three sets of instruments sit outside. An array on a pole measures rain, wind and sunlight. A shaded thermometer on the screened porch measures the air temperature. Five probes in the deck garden measure what the soil is doing around the roots. The barometer is the one instrument that lives indoors, inside the gateway itself — air pressure is the same on both sides of a wall.
None of them are wired to anything. All of them shout their readings over 915 MHz radio to a small white box indoors, and that box is the only thing on the property that touches the network. A job on the home server asks the box for its current readings once every sixty seconds and pushes them out to Cloudflare, which is what your browser is talking to right now.
The instruments
Four models · eight units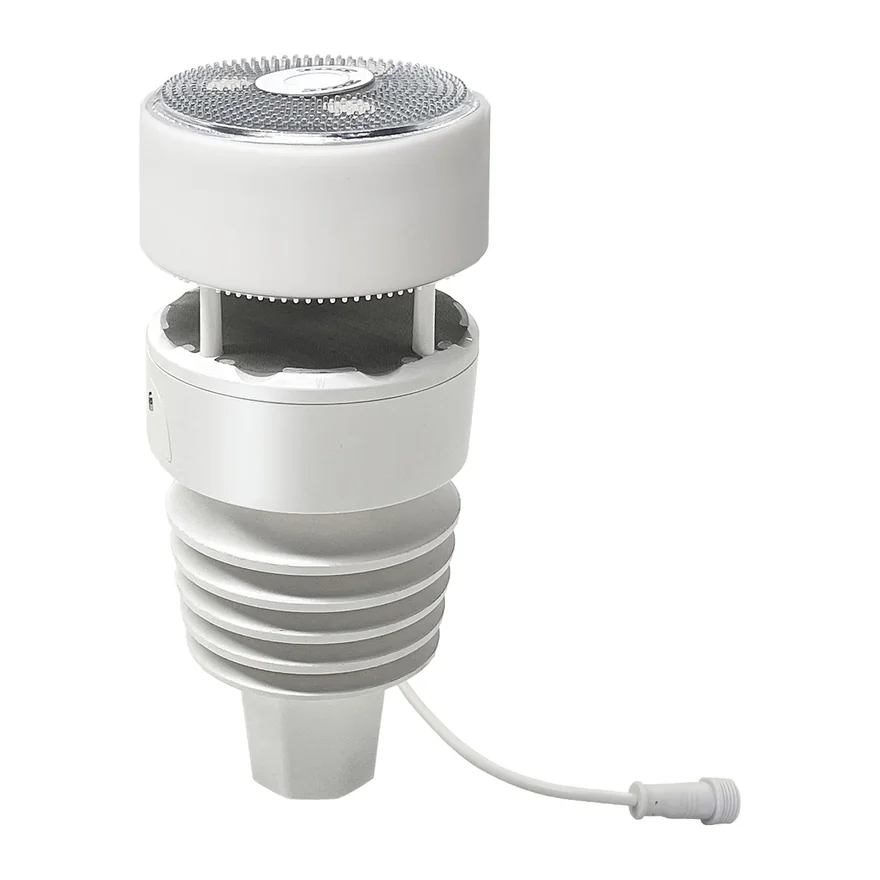
Seven instruments in one housing, eight feet up on a one-inch J-pole bolted to a deck post with clear sky above it. Rain is measured by a haptic plate that listens to drops rather than counting bucket tips, and wind by ultrasonic pulses across an open gap — so there is nothing on it that spins or wears out.
- Measures
- Rain, wind speed & direction, solar, UV
- Power
- Solar + supercapacitor, AA lithium backup
- Radio
- 915 MHz
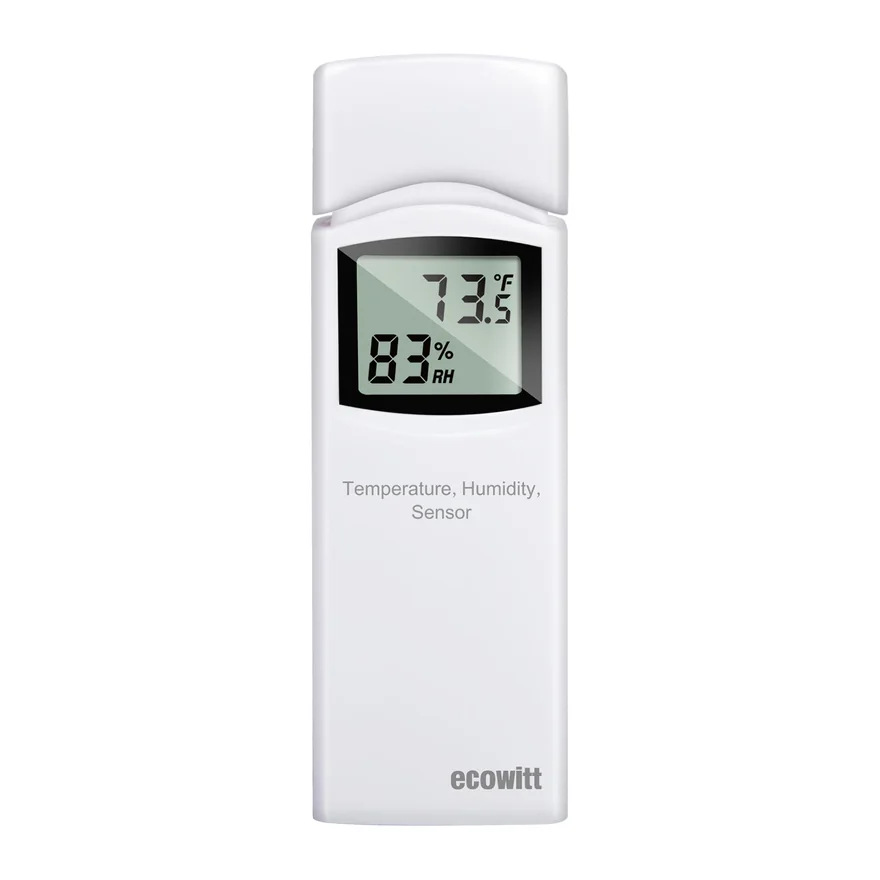
The temperature you see on the front page comes from here, not from the array. The array sits in full sun and its own thermometer reads high, so a second sensor lives in permanent shade on the screened porch — roofed against rain, screened for real airflow, and off the house wall so evening heat radiating from the siding doesn't reach it.
- Measures
- Air temperature, relative humidity
- Sited
- Screened porch, permanent shade
- Radio
- 915 MHz
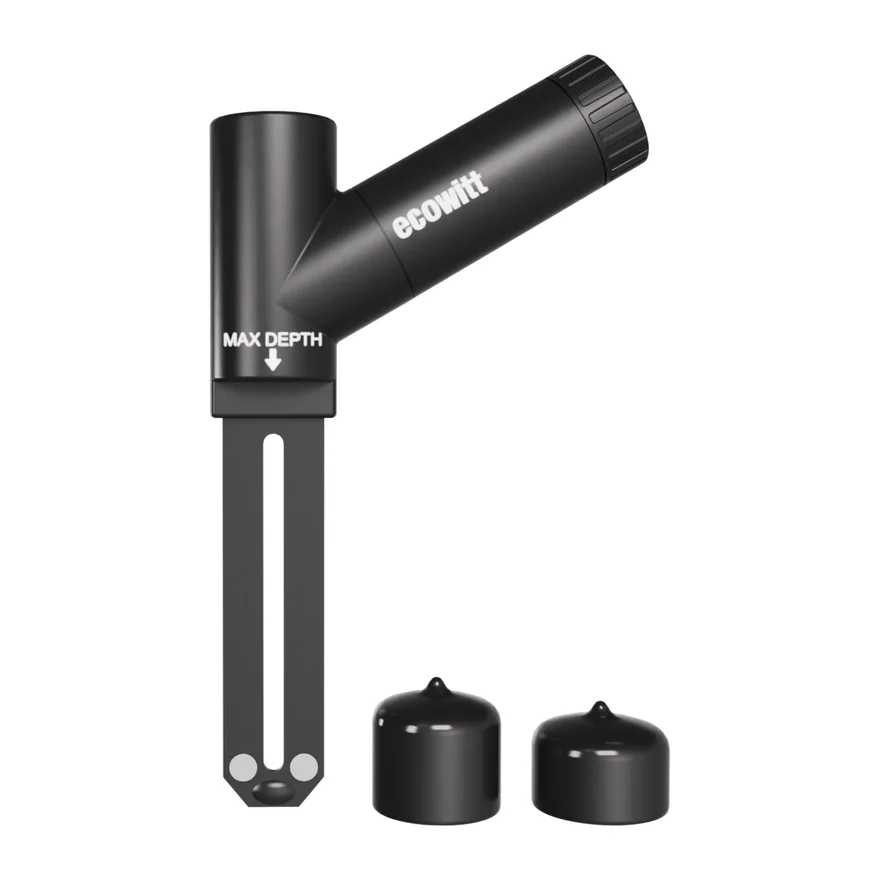
Five probes pushed in beside the roots of the deck garden, one per pot, each reporting on its own channel. Besides moisture and soil temperature they measure electrical conductivity — how salty the soil water is — which is what fertiliser leaves behind when it builds up faster than it washes out.
- Measures
- Moisture, soil temperature, conductivity
- Channels
- 1 through 5, one per pot
- Radio
- 915 MHz, reports every 70 s
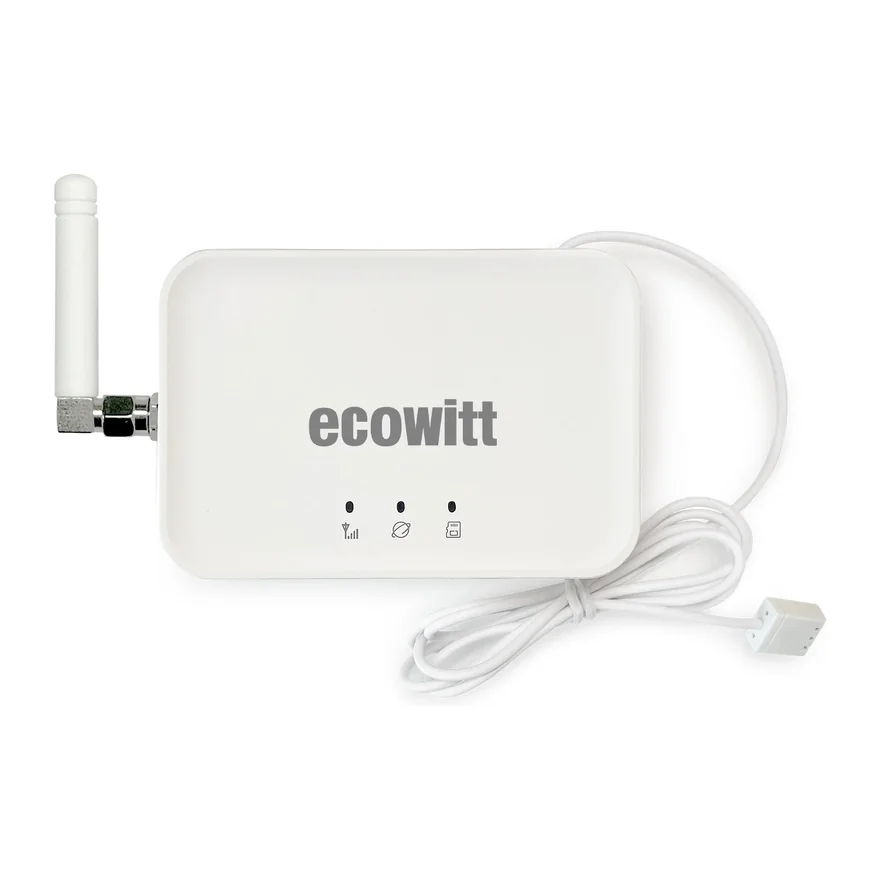
The only device of the four that touches the network. It listens for all seven radios, writes a copy to an SD card, and answers questions on the home network about what it heard last. It is also the station's barometer: pressure is measured by a sensor inside this box, indoors, because air pressure is the same on both sides of a wall. Its manufacturer cloud service is switched off.
- Hears
- WS90, WN32, 5 × WH52 — seven radios
- Measures
- Pressure, indoor temperature & humidity
- Serves
- Local HTTP API on the home LAN
Why a separate thermometer at all? It is the one decision on this list that a store-bought station would have got wrong. An all-in-one array puts the thermometer inside the same white housing that is sitting in the sun to charge itself, and on a still afternoon that housing runs hot. Every temperature on this site is the shaded reading; when the shaded sensor goes quiet, the page shows a dash rather than quietly falling back to the sunlit one.
What the numbers promise
Three rulesMissing never becomes zero
A gateway will happily repeat its last reading forever. If a sensor has not been heard from, this site prints a dash. A dash means nobody knows — it does not mean calm, dry or cold.
Every reading carries its age
The front page always answers, even when the data behind it is old, so it reports how old the reading is in words instead of showing a stale number as if it were current.
Nothing is invented
Anything worked out rather than measured — sky cover, pressure tendency, feels-like — is labelled as derived and carries the inputs it came from. No forecast is ever mixed in with an observation.
How much history there is. The station went up on 2 August 2026 and the record starts there. Daily figures are kept from the beginning; the minute-by-minute trace is kept for the last seven days and then discarded. The site says how far back it goes rather than padding a week-long chart with blanks.